Steve Koerber’s Remuera Quarterly Report
Remuera’s estimates. How accurate are they?
Q2 2025April, May, JuneRemuera Grammar Zone edition
Annual median sale price
$2,010,000
12 months to June 2025
−1.9% from $2,050,000, 12 months to June 2024
Annual number of sales
359
12 months to June 2025
+18.5% from 303, 12 months to June 2024
These figures cover all of Remuera, including sales outside the Grammar zone.
Ten years of Remuera
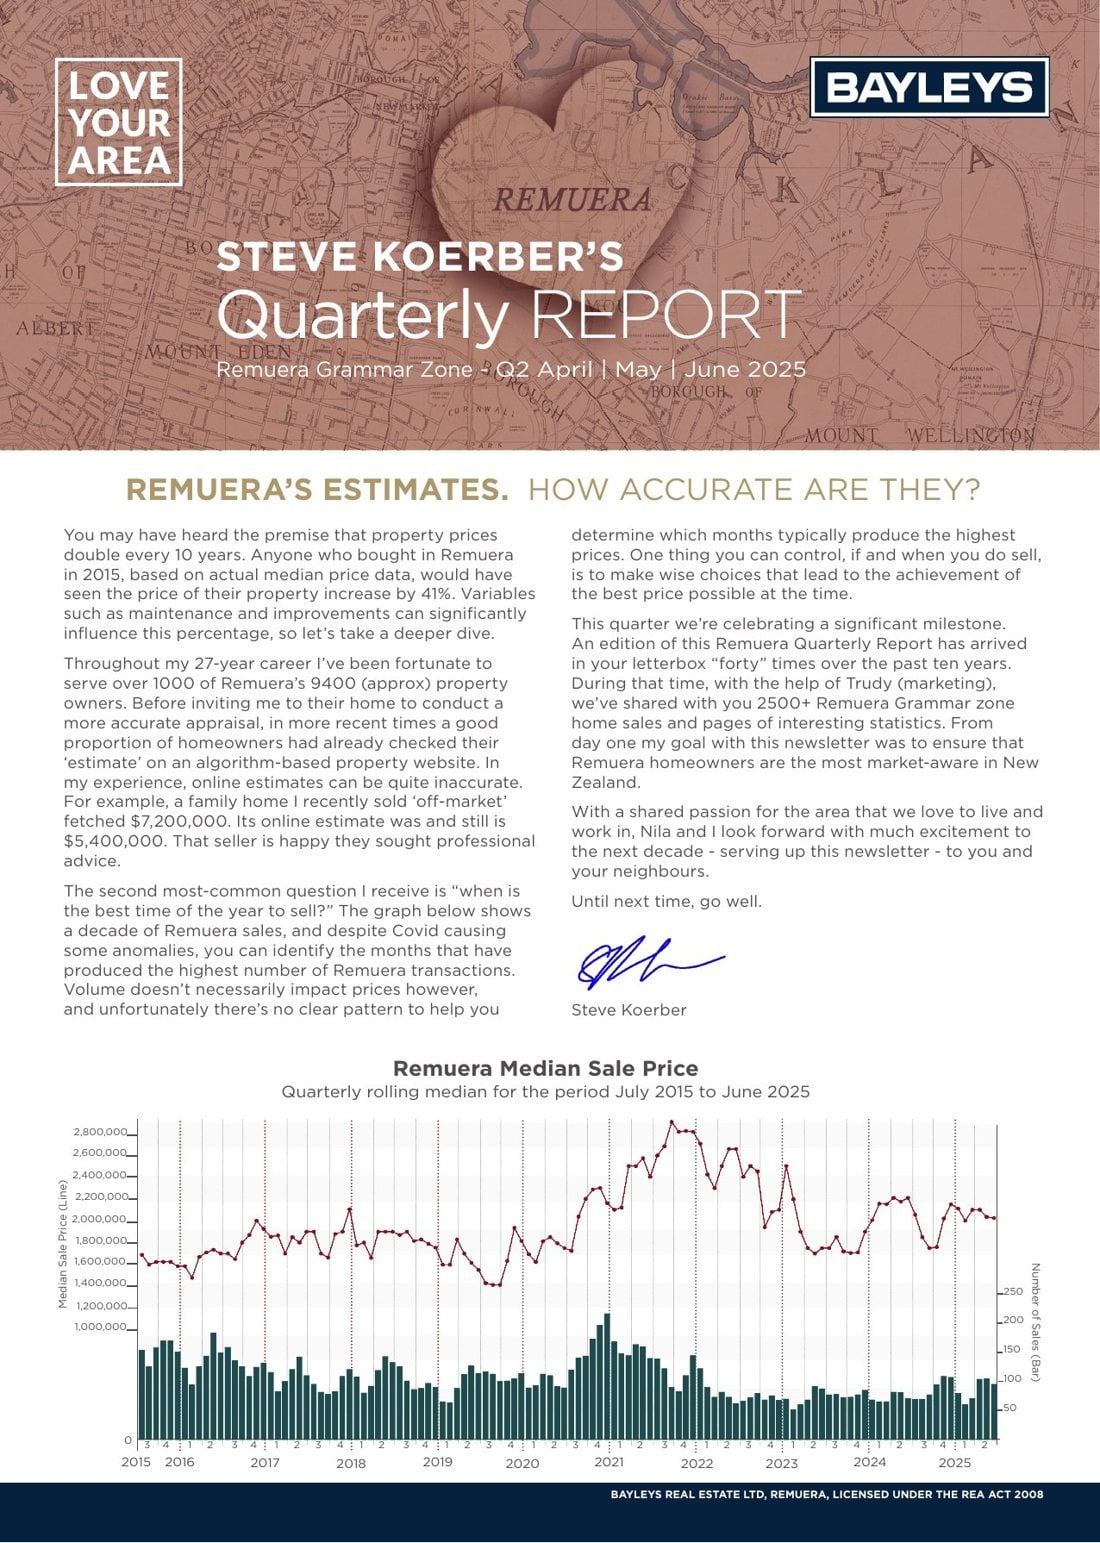
The rolling median sale price, as the red line, and the number of sales each quarter, from 2016 to the second quarter of 2025.
Reading the chart
The red line
Each point is the median of the last four quarterly medians. The scale is on the left.
Why $2,125,000, not $2,010,000
The line ends at $2,125,000, the median of the four quarterly medians from Q3 2024 to Q2 2025. The $2,010,000 above is the annual median sale price for the 12 months to June 2025. They cover different periods.
The bars
The number of settled sales in each quarter. The scale is on the right. The busiest quarter was Q4 2020, with 290 sales; the latest, Q2 2025, had 143.
The figures behind the chart
| Quarter | Sales | Annual median |
|---|---|---|
| Q2 2025 | 143 | $2,125,000 |
| Q1 2025 | 98 | $2,162,500 |
| Q4 2024 | 150 | $2,177,500 |
| Q3 2024 | 116 | $2,115,000 |
| Q2 2024 | 104 | $2,115,000 |
| Q1 2024 | 87 | $2,002,500 |
| Q4 2023 | 126 | $2,002,500 |
| Q3 2023 | 96 | $2,041,500 |
| Q2 2023 | 127 | $2,176,500 |
| Q1 2023 | 79 | $2,323,750 |
| Q4 2022 | 93 | $2,473,750 |
| Q3 2022 | 106 | $2,518,750 |
| Q2 2022 | 98 | $2,596,250 |
| Q1 2022 | 101 | $2,577,500 |
| Q4 2021 | 181 | $2,532,500 |
| Q3 2021 | 124 | $2,312,500 |
| Q2 2021 | 181 | $2,217,500 |
| Q1 2021 | 219 | $2,197,500 |
| Q4 2020 | 290 | $2,025,000 |
| Q3 2020 | 183 | $1,817,250 |
| Q2 2020 | 133 | $1,764,750 |
| Q1 2020 | 148 | $1,637,250 |
| Q4 2019 | 144 | $1,637,250 |
| Q3 2019 | 135 | $1,611,250 |
| Q2 2019 | 139 | $1,705,000 |
| Q1 2019 | 122 | $1,777,750 |
| Q4 2018 | 122 | $1,765,000 |
| Q3 2018 | 114 | $1,795,250 |
| Q2 2018 | 159 | $1,839,000 |
| Q1 2018 | 122 | $1,891,250 |
| Q4 2017 | 157 | $1,891,250 |
| Q3 2017 | 106 | $1,891,250 |
| Q2 2017 | 131 | $1,821,250 |
| Q1 2017 | 123 | $1,702,500 |
| Q4 2016 | 154 | $1,662,500 |
| Q3 2016 | 158 | $1,625,444 |
| Q2 2016 | 191 | $1,625,444 |
| Q1 2016 | 161 | $1,635,444 |
Previous issues
Run the numbers for your home.
If you’re curious how these numbers might look for your own situation, Steve and Nila are always happy to assess it with you. No pressure, no obligation and no paperwork until you’re ready.
Steve or Nila will reply personally, usually the same day.
From Steve
You may have heard the premise that property prices double every 10 years. Anyone who bought in Remuera in 2015, based on actual median price data, would have seen the price of their property increase by 41%. Variables such as maintenance and improvements can significantly influence this percentage, so let’s take a deeper dive.
Throughout my 27-year career I’ve been fortunate to serve over 1000 of Remuera’s 9400 (approx) property owners. Before inviting me to their home to conduct a more accurate appraisal, in more recent times a good proportion of homeowners had already checked their ‘estimate’ on an algorithm-based property website. In my experience, online estimates can be quite inaccurate. For example, a family home I recently sold ‘off-market’ fetched $7,200,000. Its online estimate was and still is $5,400,000. That seller is happy they sought professional advice.
The second most-common question I receive is “when is the best time of the year to sell?” The graph below shows a decade of Remuera sales, and despite Covid causing some anomalies, you can identify the months that have produced the highest number of Remuera transactions. Volume doesn’t necessarily impact prices however, and unfortunately there’s no clear pattern to help you determine which months typically produce the highest prices. One thing you can control, if and when you do sell, is to make wise choices that lead to the achievement of the best price possible at the time.
This quarter we’re celebrating a significant milestone. An edition of this Remuera Quarterly Report has arrived in your letterbox “forty” times over the past ten years. During that time, with the help of Trudy (marketing), we’ve shared with you 2500+ Remuera Grammar zone home sales and pages of interesting statistics. From day one my goal with this newsletter was to ensure that Remuera homeowners are the most market-aware in New Zealand.
With a shared passion for the area that we love to live and work in, Nila and I look forward with much excitement to the next decade – serving up this newsletter – to you and your neighbours.
Until next time, go well.
Steve Koerber